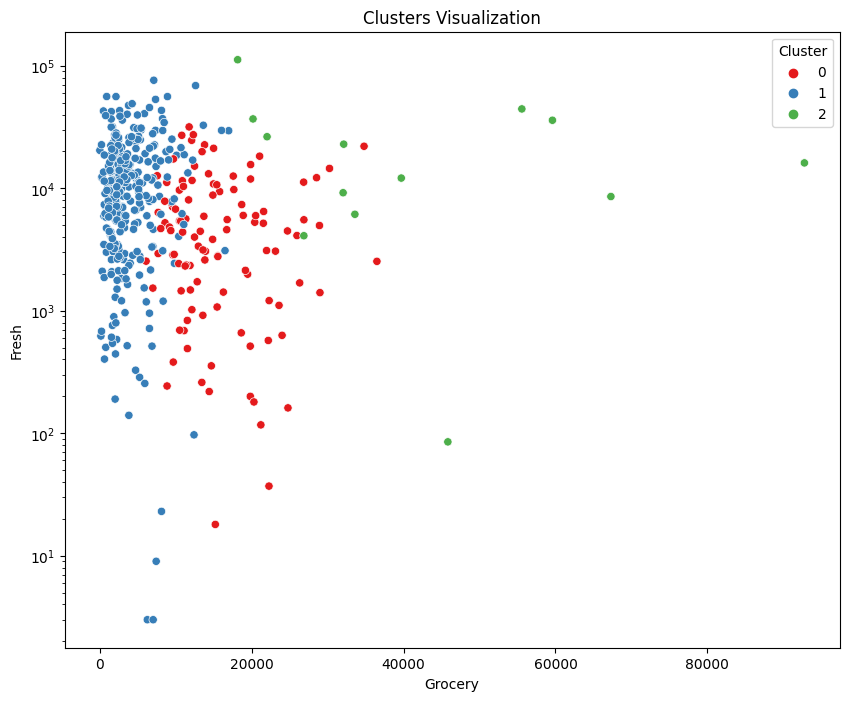
Segmenting 440 UCI Wholesale customers into three actionable marketing personas using K-means — methodology, decisions, and trade-offs.
Three clusters on Grocery vs Fresh axes
Most marketing budget in small-to-mid B2B distribution gets burned on blanket campaigns. A wholesale distributor with 400-odd customers sends the same "10% off all categories" email to a neighbourhood cafe, a 50-checkout supermarket, and a specialty deli — three businesses that buy almost nothing in common. The cafe ignores the detergent discount, the supermarket was going to buy at that price anyway, and the deli wanted a Delicatessen-specific promo that never arrived. Every dollar of spend in that broadcast hit a segment it wasn't written for.
I picked this project because segmentation is the cheapest lever in that kind of operation. You don't need more customers, a bigger CRM, or a predictive model — you need to stop treating the list as one bucket. K-means is the most boring, well-understood, easily-explained way to get there, which is exactly why I chose it over something flashier.
Before writing a line of code I considered three clustering algorithms seriously:
Hierarchical (agglomerative) clustering gives you beautiful dendrograms, doesn't force you to pre-pick k, and tells a nested story. It's a great analytical tool. It's not, in my experience, a great decision tool. My audience for this output is a marketing team, not a PhD committee — a dendrogram is a conversation-starter, not a lever. "Here is the tree, cut it wherever feels right" is not an instruction anyone in a marketing ops meeting will act on.
DBSCAN is density-based, finds non-globular shapes, and surfaces outliers as their own class. Very good when you suspect your segments aren't spherical — for example, if there's a long narrow ridge of "mid-Fresh, mid-Grocery" customers that K-means would awkwardly bisect. My honest read on this dataset is that spend behaviour is roughly globular in scaled space — buyers cluster around archetypes rather than along manifolds. DBSCAN also has two hyperparameters (eps, min_samples) that are more annoying to tune on a small dataset than K-means' single k. I left DBSCAN as a follow-up experiment rather than a baseline.
K-means has one hyperparameter. Its centroids map directly to "the average customer in this segment looks like this." It's trivial to explain to a non-technical stakeholder: "we found three centres, then assigned each customer to the nearest one." It plays nicely with StandardScaler. And it matches my mental model of personas being defined by typical spend, not dense spend.
K-means won on interpretability and on matching the problem shape. The cost — having to pick k up front, and an implicit assumption of roughly spherical clusters — felt acceptable for a marketing persona exercise. I wanted personas a marketer could actually act on, and K-means is the algorithm that most naturally outputs them.
The UCI Wholesale Customers dataset has 440 rows and 8 columns:
Channel — 1 (Horeca: Hotel/Restaurant/Cafe) or 2 (Retail)Region — 1 (Lisbon), 2 (Porto), 3 (Other)Fresh, Milk, Grocery, Frozen, Detergents_Paper, Delicassen — annual spend in monetary units across the six product categories440 rows is small by any modern standard. That's actually a feature of this exercise, not a bug. At this size you can see every cluster with your own eyes on a scatter plot, sanity-check centroids against specific customer rows, and tell a coherent story without hiding behind "the model knows best." I wanted to force myself into that discipline — if I can't look at the clusters and recognise the business, the segmentation isn't useful. Scaling an unclear story to a million rows just produces a million-row unclear story.
Initial sanity checks:
Channel and Region are categoricals I chose not to feed to K-means. They're useful for interpreting clusters after the fact ("is this segment mostly Horeca?"), but mixing categoricals into Euclidean distance without careful encoding makes the math noisy. Keeping them as post-hoc labels was the cleaner call and let me cross-tab clusters against Channel/Region as a validation step rather than a confound.