Tech: Power BI - Power BI Service (web modeling) - Deneb (Vega-Lite + Vega) - DAX - Python (data pipeline) - IBCS
Dataset: City of Vancouver Open Data - capital project budget + the multi-year capital plan (Open Government Licence - Vancouver)
Status: Work in progress. The Python data pipeline, the star-schema model, the DAX measures, and 9 Deneb custom-visual specs are built and tested. The rendered report pages and screenshots are the active block, building on the Power BI Service web path (no Windows needed). Screenshots coming once a page is presentable.
I work in healthcare analytics (cancer-system intelligence at BC Cancer), where most of my Power BI and Deneb work turns clinical and operational data into decisions. My sector focus is BC public-sector and crown corporations, and there is a specific gap in that world: finance teams at places like BC Hydro, ICBC, TransLink, WorkSafeBC, and provincial health authorities run on Power BI, but most are Excel-first and short on analysts who can do honest variance reporting in the visual grammar finance actually uses.
Most entry-level BI portfolios are a sales dashboard. That does not demonstrate finance fluency, and it does not demonstrate IBCS, the International Business Communication Standards that serious finance reporting follows. So this is the piece I wanted to exist: a finance dashboard, on real public money, built to the standard.
Picking the dataset was half the work. I wanted something public, operational, and rich enough to carry all four dimensions IBCS variance reporting needs: budget, an actual, multiple years, and multiple departments, in one source.
The City of Vancouver Open Data portal publishes its capital project budget and its multi-year capital plan as CSVs under the Open Government Licence. Together they give the full picture: roughly CAD 8.6 billion of planned capital across service categories, business units, and fiscal years. It is real public money with a real structure, and anyone can reproduce the work without an NDA.
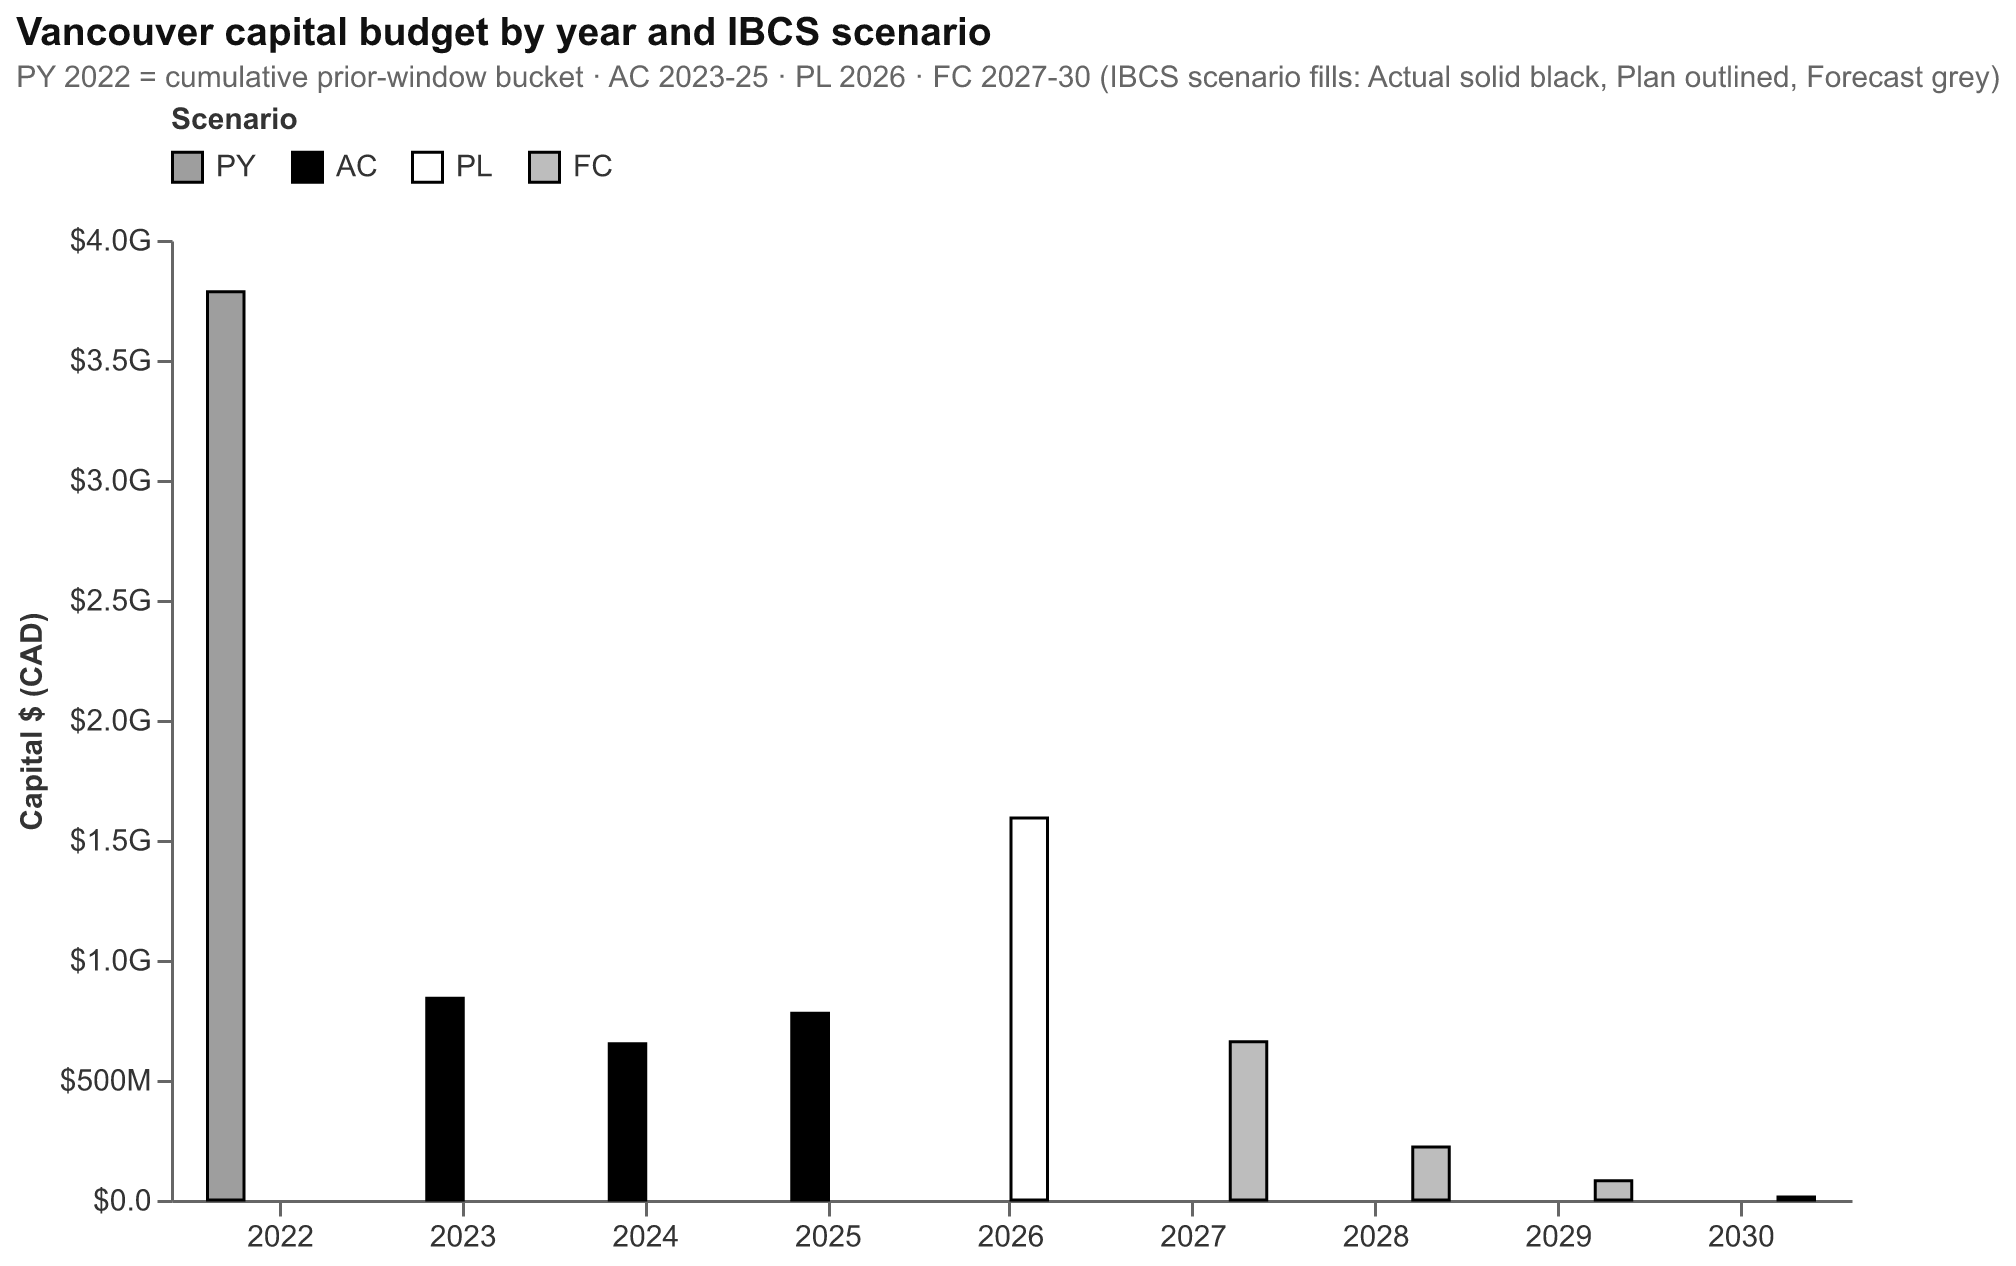
Vancouver capital budget by year and IBCS scenario - PY 2022 is the cumulative prior-window bucket; AC 2023-25, PL 2026, FC 2027-30
The raw files are wide government spreadsheets. A small Python pipeline unpivots them into a clean star schema (one fact table plus account, period, cost-center, business-unit, and scenario dimensions) and maps each raw column honestly onto the IBCS scenario set: Prior Year, Actual, Plan, Forecast.
The honest part matters here. Vancouver does not publish a per-project actual-spend ledger, so I document "Actual" as an approved-budget-for-an-elapsed-year proxy rather than pretending it is an audited spend figure. A finance reviewer should see that stated, not buried. The pipeline is test-covered: the modelled fact total reconciles back to an independently re-parsed control total.
The visuals follow IBCS notation: black for Actual, grey for Prior Year, outlined for Plan, hatched for Forecast; variance green when better and red when worse, never inverted by metric direction; at most three colors plus greyscale per page. That reads like a Zebra BI dashboard, but it is reproduced natively in Power BI plus Deneb (9 specs: 8 Vega-Lite, and a Vega cost-allocation Sankey, since Vega-Lite has no native Sankey mark), so the work stays free and portable instead of leaning on a per-user custom-visual license.
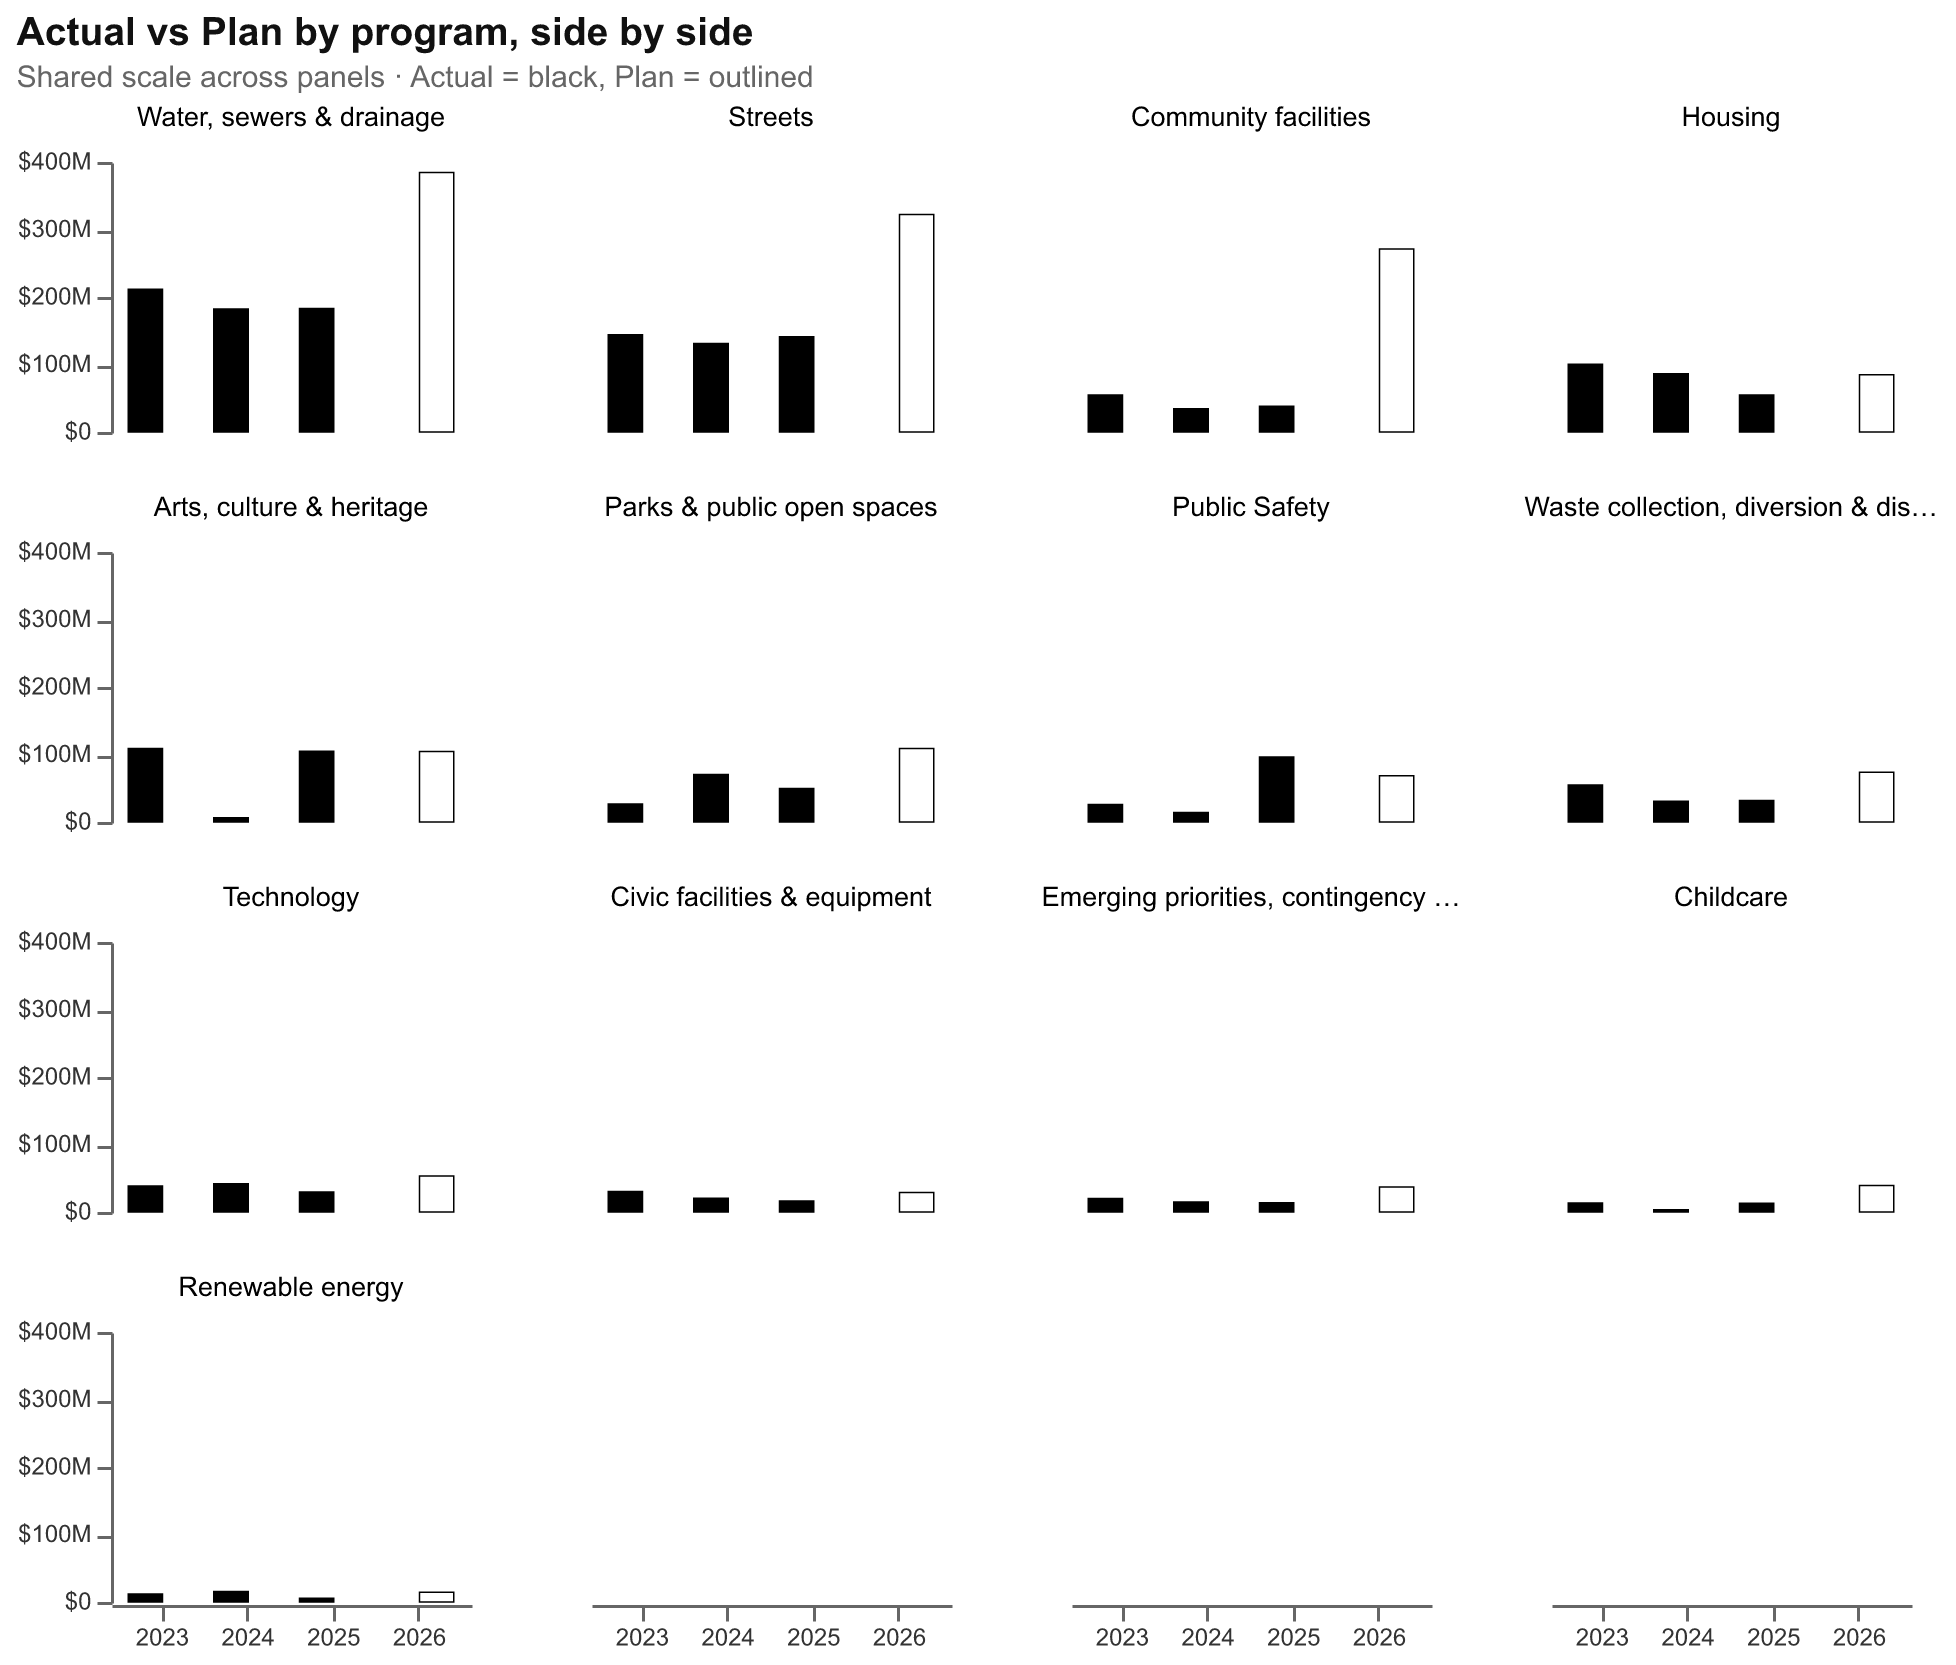
Capital by year per program (small multiples) - Actual 2023-25 solid, Plan 2026 outlined, shared scale
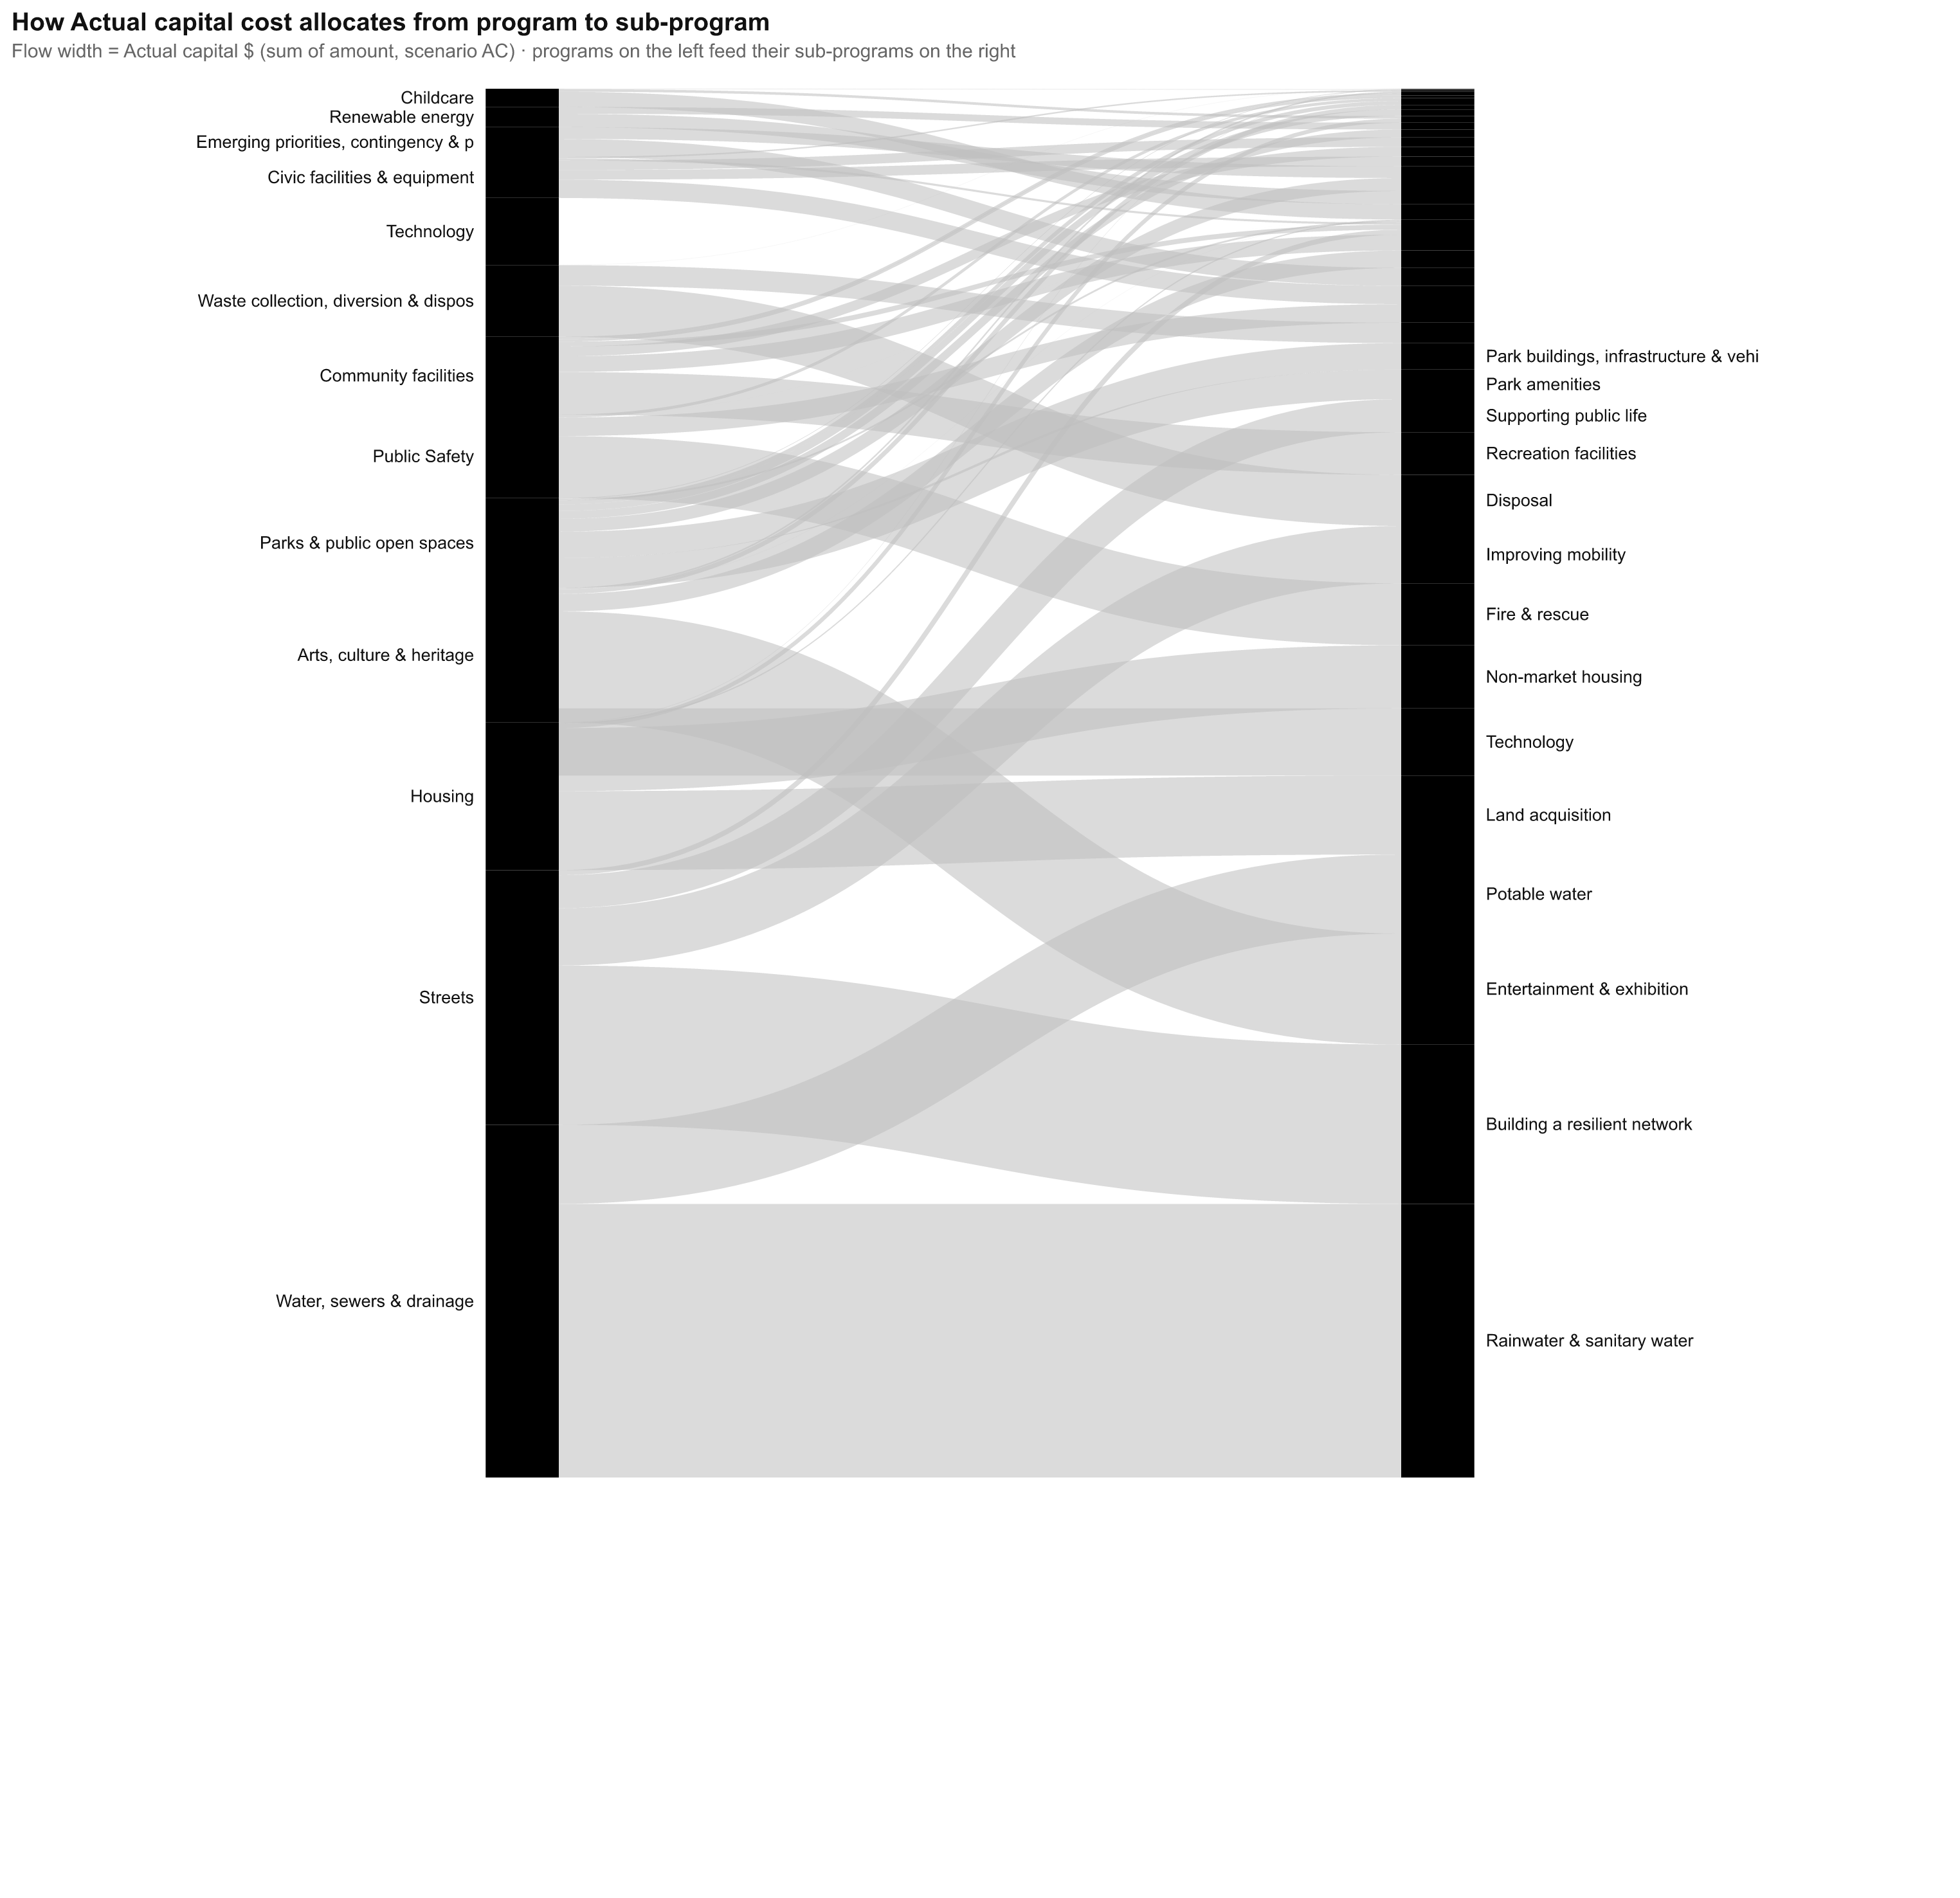
Cost allocation - how Actual capital flows from program to sub-program (Vega Sankey, the one chart Vega-Lite cannot draw)
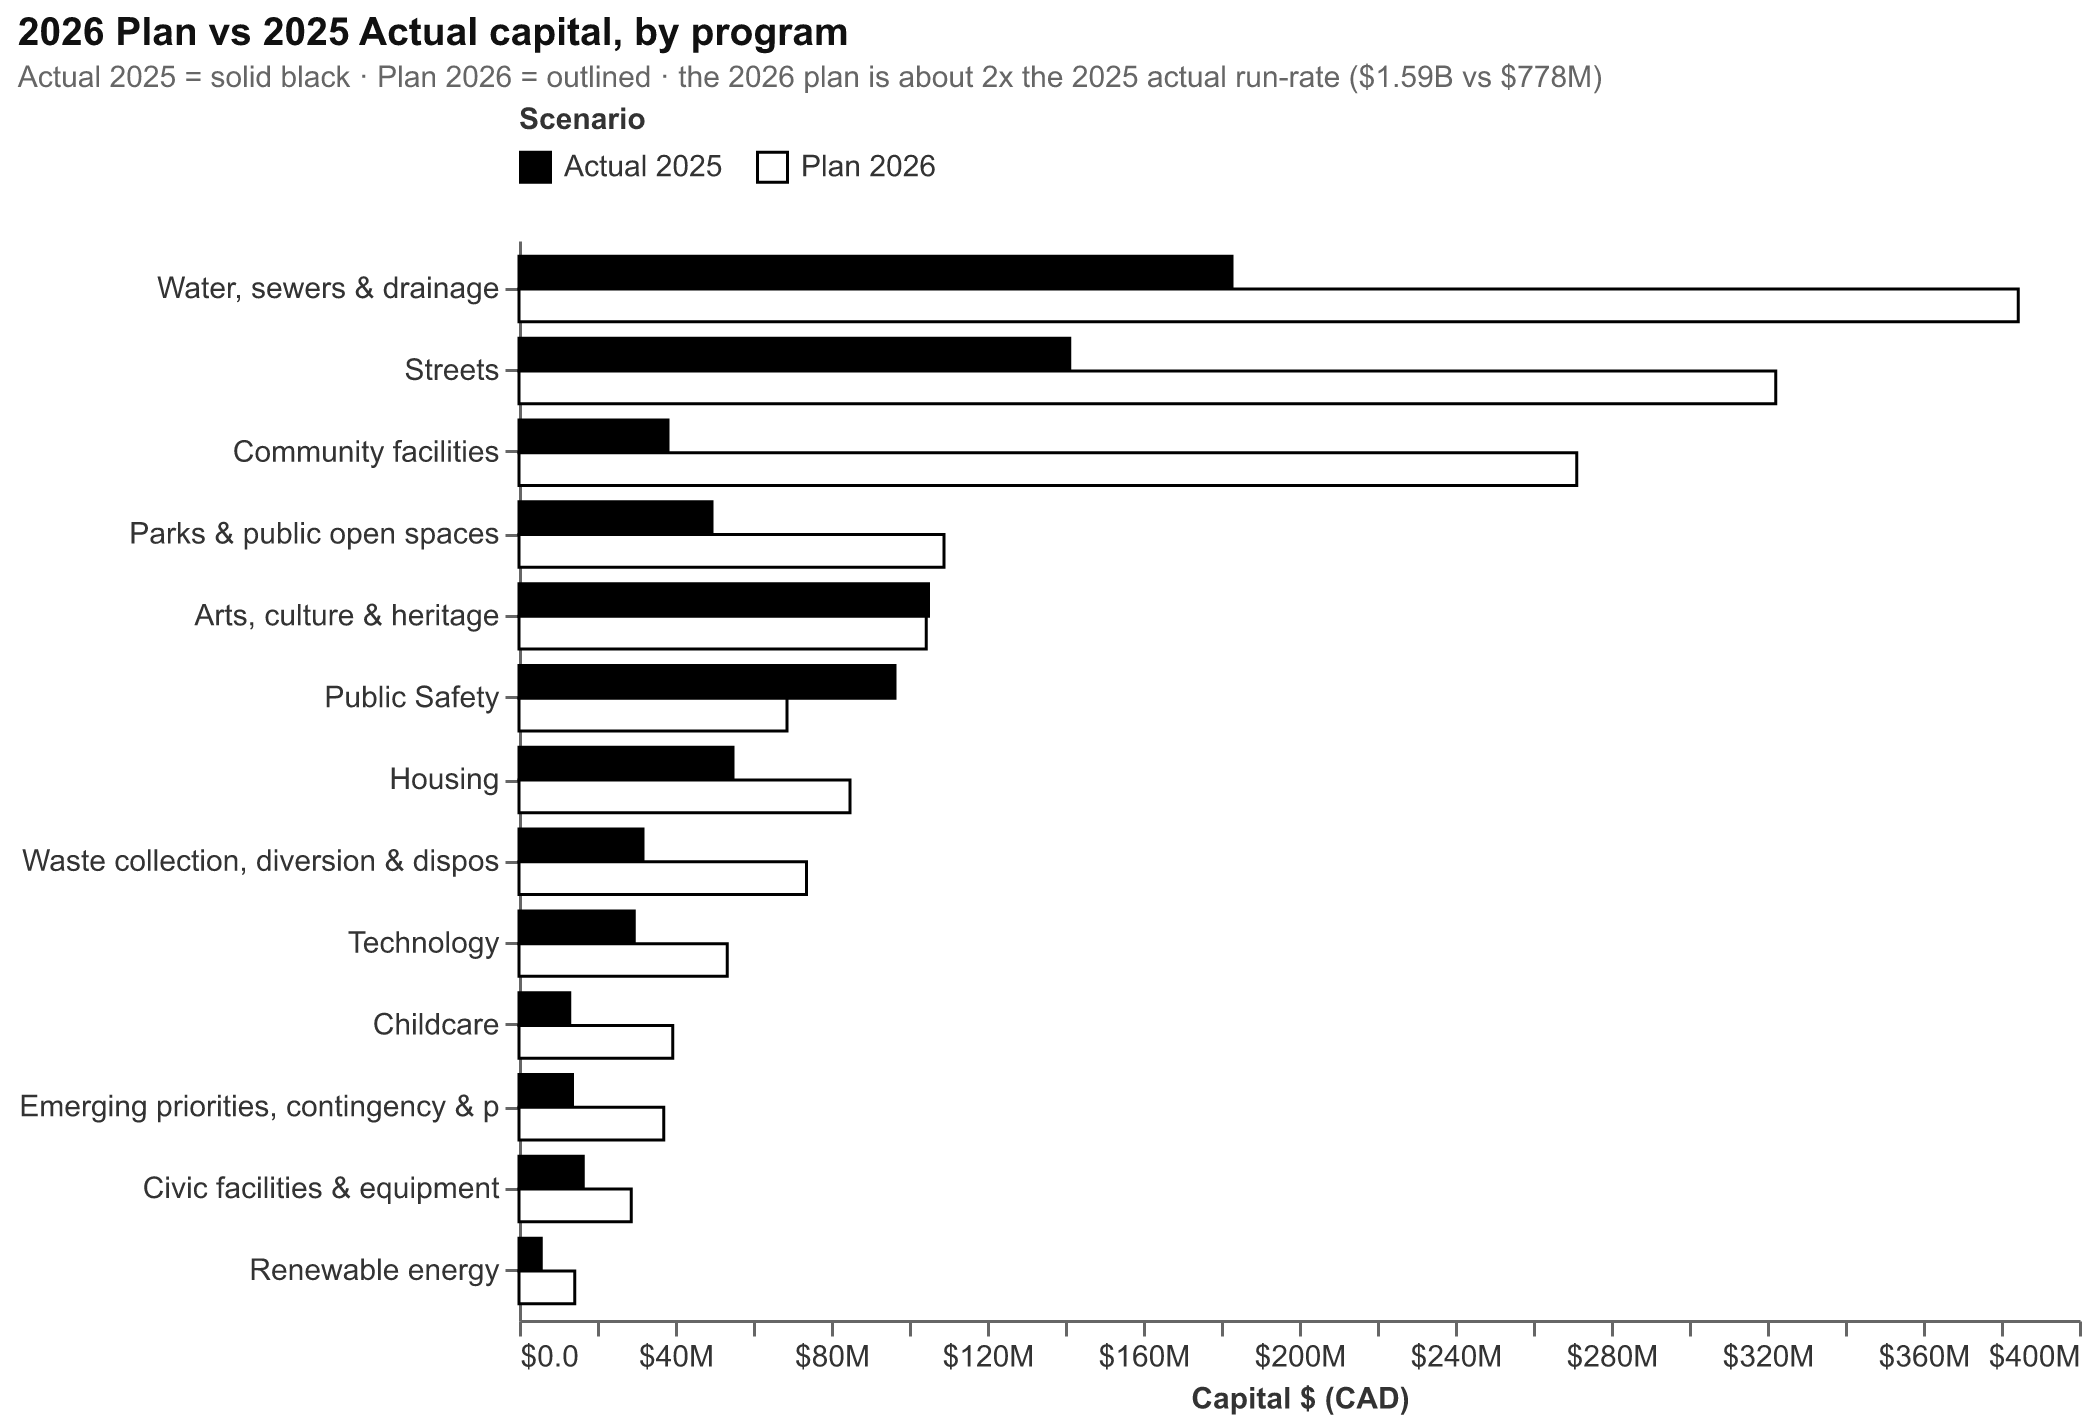
2026 Plan vs 2025 Actual capital by program - rendered from the project's Deneb spec against City of Vancouver Open Data